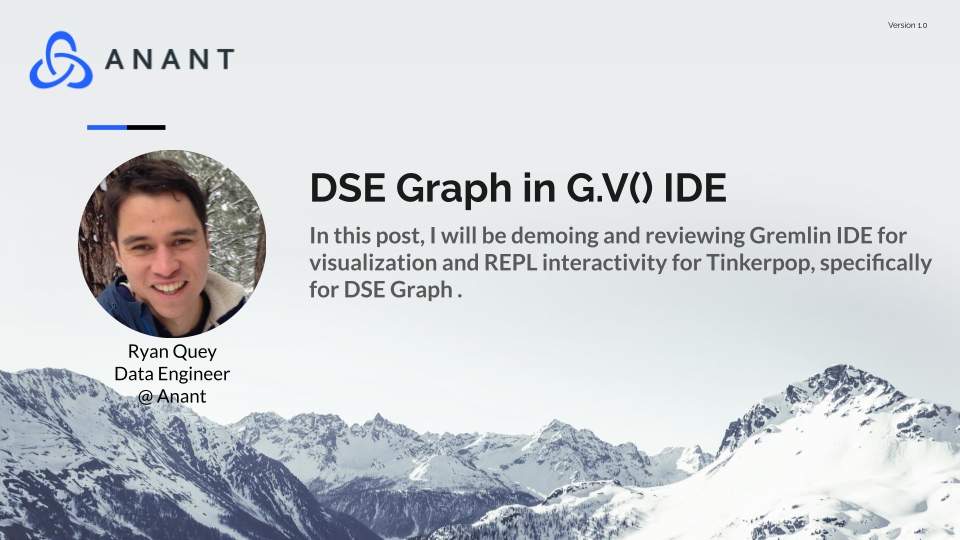
For several months now I have had my eye on G.V() IDE, an exciting new development in the Tinkerpop/Gremlin world. However, I wanted to wait for G.V() IDE to have compatibility with DSE Graph before giving it a test run – which became true as of the recent 0.9.14 release. Why is this an exciting new development, you may ask? A major hurdle for new developers getting started with Tinkerpop is the query language. While there is documentation and an active community that is (surprisingly) responsive and willing to help beginners, the Gremlin query language still creates a learning curve.
Add to that the difficulty of identifying mistakes until runtime, and the process of developing applications in Gremlin can become quite demanding.
However, lately, there have been various efforts at helping mitigate this learning curve. Previously I reviewed AWS Graph Notebook, a tool that provides a Jupyter notebook environment for graph databases. In this post, I will be taking a look at another tool that provides out-of-the-book visualization and REPL interactivity for Tinkerpop, but this time around in the form of an IDE: G.V().
The name of the IDE (pronounced “g dot v”) might be strange for the uninitiated, but it refers to the core syntax that starts a vast majority of Gremlin queries: g.v(), which we perhaps can say is somewhat akin to the famous SELECT * from the relational DB world.
Beyond just visualization, I’d say its main selling point is help in both writing Gremlin queries (through code autocompletion, linting, etc) and parsing the queries’ results, which can be a journey in itself.

In its own words:
G.V() is an all-in-one Gremlin IDE to write, test and analyze results for your Gremlin graph database. It offers rich a UI with smart autocomplete, graph visualization, editing and connection management.
In this post, I will provide a quick-start guide (complete with docker-compose file and bash startup scripts) as well as some initial impressions.
Getting started
The G.V() IDE GUI is overall pretty intuitive to use, and there’s even a one-click option to start playing around in a Gremlin Playground.
However, one thing, in particular, that wasn’t as clear for me at least was how to create a connection to DSE. In the next section, I outline a way to get quickly set up with DSE Graph and G.V() IDE.
Setup your DSE Graph
Actually, before you can make a connection from G.V() IDE to your DSE Graph, you need to initialize your graph in DSE first, or else it will refuse to connect, saying There is no graph available.

We have some scripts and a docker-compose file you can use if you want to follow along on your own machine, which you can find here: https://github.com/Anant/dse-gdotv-demo. Follow the instructions in the README there, and then come back here when you’re finished.
Configure a connection from G.V() IDE to DSE Graph
After accepting some EULA agreements and so on, we are greeted with a screen that looks like this:

Click the “Add New Connection” button and then, in the modal that pops up, “Advanced Settings”.
With DSE 6.8 running on docker on my local machine, I simply put in the following:

Note that neighborhoods_dev.g is because our graph is called neighborhoods_dev, so this creates an alias to that graph in particular. If you are using a different data set you will have to change this to match your graph name.
Some Highlights in G.V() IDE
Graph Model Explorer
With just a click, you can see what your data model is and how different entities relate to each other:

This even fetches counts of vertices – though I’m not sure how this works for larger graphs, where running several counts like that might take some time.
Graph Data Explorer
G.V() IDE comes with a data explorer GUI to quickly visualize your graph data.
First, you select a basic subset of your data to start with using a form:

The default vertices, 25, are a bit much for our dataset, but if you change it to 1 or 2, you can start getting a feel for your data, all before writing a single Gremlin query. In my case, I will start with a credit card that has a given credit card number:

Results come out to this:

Enable “Data Explorer” mode, and when you click on nodes it automatically populates “neighboring nodes” (i.e., adjacent vertices). For example, after clicking on a “transaction” for this credit card, I find the “vendor” vertex that is attached:

Or you can click around to see the status of a loan payment from the credit card owner:

Visualization Customization
There are many options available to customize how vertices and edges show up in your graph, including color, text style, border style, and more.

Changing the node label, in particular, can make for a much more pleasant graph to look at:

It would be nice to have some sort of templating ability here, to customize this further. Regardless, as it is it still helps quite a bit.
Visualization Presets / Effects
One other feature that is really nice is that you can also change the base organization of the visualization from a number of preset options. Here’s just a handle of examples (among many we could give) for the curious.
D3 Force layout:

AVSDF:

Breadth First:

Quickly add or edit vertices and vertices within the GUI
One surprising feature is that you can perform writes to your graph data straight from the GUI.
For example, by clicking on a vertex, you can edit its properties:

You can even create vertices or edges. For example by clicking on a vertex and drawing a line to another vertex. Since we’re using DSE, you have to make sure the new edges and vertices fit your schema though. G.V() IDE will try to help you some, for example by populating available properties when you select an edge or vertex label to create, but in the end, you have to know your schema yourself as well for this.
For example below, I created a new vertex for label “Customer” named “Bill” and made him an owner of one of the accounts:

Query Builder
Perhaps the biggest draw for G.V() IDE is the query builder:

This is the main rationale for calling G.V() an “IDE”. Not only can you run and save queries in different tabs, but as you write the queries it gives a variety of helps.
Autocompletion for steps
For example, it has autocomplete for traversal steps as you type:

As you can see above, this even shows official Tinkerpop documentation on the right-hand side, or optionally you can toggle to java docs instead.
Autocomplete based on your schema
G.V() IDE also provides suggestions based on your schema. For example, knowing that the has step can take a label or a property name as its first argument, the IDE provides a list of labels and property names from your schema.

Once again, it shows details about the currently selected label in the sidebar, as shown above.
Output Parsing
The output of the Gremlin query is returned in various forms
Output: Raw
This is the output view that is to be expected: the raw data.
Included here is the gremlin console output as well as a JSON formatted output:

As those who have tried to use Gremlin before know quite well, this is often not very human-friendly to read. Fortunately, there are other views as well.
Output: Vertex View
There is also a “Vertex View”, which shows just the vertices in a nice chart:

This view is searchable and filterable by label, making it even easier to navigate your graph.
There is even the option to delete these vertices from the GUI itself.
Even traversals that ended in an edge (e.g., g.V().outE()) showed this without any issue.

Output: Edge View
For Gremlin queries that include edge data, you can use the “Edge View” to explore just the edges:

This provides a much nicer interface for browsing your edges than the raw data, which is often only barely human-readable.
Note that traversals that terminate at a vertex don’t show edges, even if edges were traversed on the way there (e.g., g.V().out()). Only traversals that ended in an edge (e.g., g.V().outE()) showed these.
If you enable the option to “Fetch all edges between vertices” however, then traversals ending in a path (e.g., g.V().out().path()) also show the edge view and all edges in the path:

Furthermore, though this option won’t necessarily show edges on the path that were traversed along the way, this option will show edges that happen to be connected between vertices that are returned. For example, for this query that returns a bunch of random vertices, G.V() IDE identifies edges between these vertices and returns them as well, something that doesn’t happen in DSE Studio or AWS Graph Notebook.

This is also important to make sure that the Graph View has nicely connected vertices:

Without enabling this option which returns these edges, it just returns a bunch of disconnected nodes:

For those of you who have struggled to get a nice looking visualization of your queries to display in other tools like DSE Studio or AWS Graph Notebook (say, for a blog post or presentation for example), I’m sure that you know the helpfulness of this feature!
Comparison to DSE Studio
Before wrapping up, I just wanted to highlight some pros and cons in comparison to DSE Studio and AWS Graph Notebook really quick. Of course, each of these is a very different tool, but due to a decent amount of overlap in functionality, it might be helpful when deciding what to try out for your graph project.
Areas where I like G.V() better
- IDE features such as built-in docs and code completion can be extremely helpful, especially for beginners.
- Visualization
- Has greater flexibility for which traversals can be visualized, especially with its feature to Fetch edges between vertices.
- Can switch what type of visualization to use (e.g., force-directed graph, AVSDF, etc)
- Translation to target language (JS, Python, or .net) and code formatting using Gremlint.
- Ability to edit nodes and edges from the GUI.
- “Vertex View” and “Edge View” tabs in the output.
- Compatibility for several other Tinkerpop graphs, not just DSE Graph.
Areas where I like DSE Studio better
- G.V() is not a notebook. This means you cannot layout commands in a sequence, cannot programmatically export and save these sequences of commands to source control (though you can save queries in the desktop app itself), and (as far as I can tell) can’t seem to save query results or visualizations between sessions.
- Not as programmatic to setup – You can’t just run a script and get it up and running with the settings you want, or run it out of a docker-container.
- Serving over HTTP. Being a Desktop application, G.V() IDE is not served over HTTP, which has implications for setup, connecting remotely, etc.
- Windows support – Windows desktop app seems more buggy.
- More buggy, still working out kinks (which will probably get resolved more and more as time goes on)
- Label text can be totally customized in DSE Studio, using templating format
Comparison to AWS Graph Notebook
The comparison between G.V() IDE and AWS Graph Notebook is similar to the comparison made to DSE Studio in a lot of ways, but also to add:
Areas where I like G.V() better
- Similar to when compared to DSE Studio, G.V() IDE has the advantage of code completion, built-in docs, and the ability to edit notes from the GUI.
- Easier to configure visualization (AWS Graph Notebook has a syntax to do styling, but for styling like that GUI is easier). However, Graph notebook can have everything configured programmatically
- Ability to easily traverse out to nearest neighbors just by clicking on a node, which is in both DSE Studio and G.V() IDE.
Areas where I like AWS Graph Notebook better
- AWS Graph notebook has much more in the way of datasets to get started with, and instructions on how to start playing around with the data.
- AWS Graph returns more in the way of query metadata by default in its “Query Metadata” output.
- Not open source
Wishlist
A review of a new tool like this would be incomplete without a wish list 🙂 Some things that would be great to see at some point in the future:
- Error message popup when something breaks
- There are logs you can access (e.g., for Linux found at
~/.config/gdotv/logs/main.log) but given this is a GUI-focused tool, it would be nice to see something in the UI also.
- There are logs you can access (e.g., for Linux found at
- Did not work as well from Windows – in particular, hover boxes were misplaced and when you clicked on the auto-suggestions it didn’t do anything. However, it worked fine on my Linux desktop (i.e., not WSL).
- Renaming tabs (or at very least, “Graph Model explorer” and “Graph Data Explorer” should have tabs that are named accordingly)
Conclusion
Even without any of the suggested additions and features mentioned above, G.V() IDE is a major addition to the Tinkerpop ecosystem and for DSE Graph in particular. It shows a lot of promise, especially when doing development. Personally, I plan on continuing to try it out on graph projects as opportunity allows. I am not sure what the planning model might end up being in the future but at least for now, it’s free and definitely worth checking out if you get a chance.
Cassandra.Link
Cassandra.Link is a knowledge base that we created for all things Apache Cassandra. Our goal with Cassandra.Link was to not only fill the gap of Planet Cassandra but to bring the Cassandra community together. Feel free to reach out if you wish to collaborate with us on this project in any capacity.
We are a technology company that specializes in building business platforms. If you have any questions about the tools discussed in this post or about any of our services, feel free to send us an email!


