In this post, I will walk through how to visualize data from Cassandra in Superset (by means of Presto), and along the way share some observations about my experience and potential use cases that might be interesting for you.
Apache Superset has been around for a while now and has gained quite a bit of traction. I personally heard about it through an interview on the Astronomer podcast with Maxime Beauchemin, who is the creator of not only Apache Airflow, but Superset as well. Having an interest in data visualization, I’ve been looking forward to exploring Superset and seeing what it contributes to the larger data visualization ecosystem as a whole.
Quick disclaimer: I approach this topic more as a data engineer than a data scientist and will be writing from that perspective, so I will be writing from that perspective. Hopefully, it will be helpful for other data engineers who, like me, have limited experience with data visualization but want to learn more.
Introduction to Superset
Superset bills itself as “a modern data exploration and visualization platform.” It will come as no surprise to learn that it is built to work well with distributed platforms, given that its creator also created Apache Airflow. In its docs, Superset claims that it is “cloud-native and designed to be highly available. It was designed to scale out to large, distributed environments and works very well inside containers. While you can easily test drive Superset on a modest setup or simply on your laptop, there’s virtually no limit around scaling out the platform.”
Part of how it does this is through its infrastructure, which requires a webserver, a metadata db engine, a message queue, a results backend, and a caching layer. Some of these components can overlap – for example, in the setup for this tutorial, we will cover these five requirements with just these three components: Gunicorn webserver, Redis (for the message queue, results backend, and caching), and Postgres (for the metadata db).
Ingesting your Cassandra data into Superset
In regard to how you ingest your data, Superset works with most interfaces that support SQL queries. This means that while Yugabyte for example, works out of the box due to its Postgres compatibility, Cassandra does not. For this reason, if you want to visualize data from Cassandra in Superset, a post by the Senior Developer Advocate for Superset recommends using an intermediate query engine like Trino or Presto. This setup provides the SQL compatibility to Cassandra that we need, as well as other benefits that come with such a tool in the process.
What we cover in this post
First, we will connect Cassandra with Presto using docker-compose. From there, we will follow this guide to setting up Superset in docker-compose to connect Superset to Presto. You can find the code behind this post on GitHub.
Step 1: Connecting Presto with Cassandra
For connecting Presto with Cassandra, there is nothing too novel with this process, as it has been well documented already. We will be using the docker image provided by Ahana; for more information on that container, see here.
In order to avoid putting more details in here than we need to, for this part of the tutorial you can follow the README in the GitHub repo for a step-by-step guide.
The gist of it is to start up the Docker containers using docker-compose, then create a catalog in Presto for Cassandra. We will name ours cassandra (go figure).
Ingest Sample Data into Cassandra
We will also ingest some sample data at this point as explained in the GitHub README. For this, you can ingest by doing writes through Presto (using SQL) or CQLSH (using CQL).
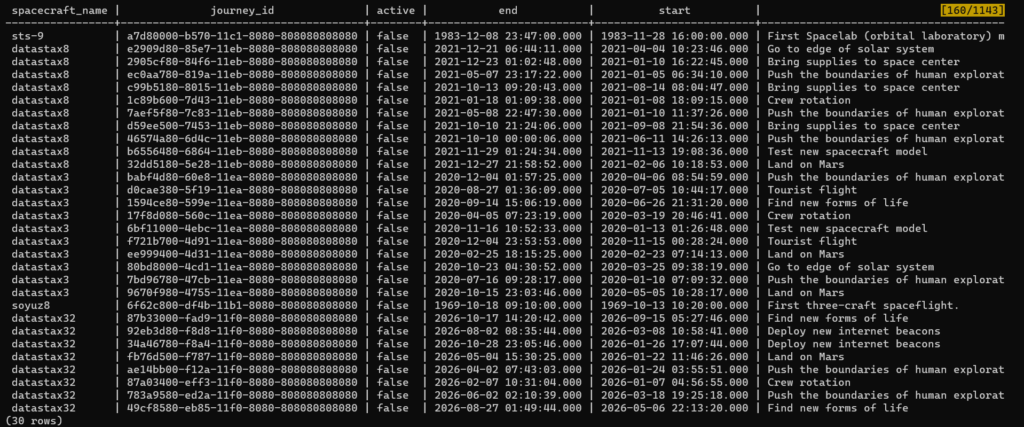
At this point, our data is now accessible in two ways: 1) From Cassandra directly:
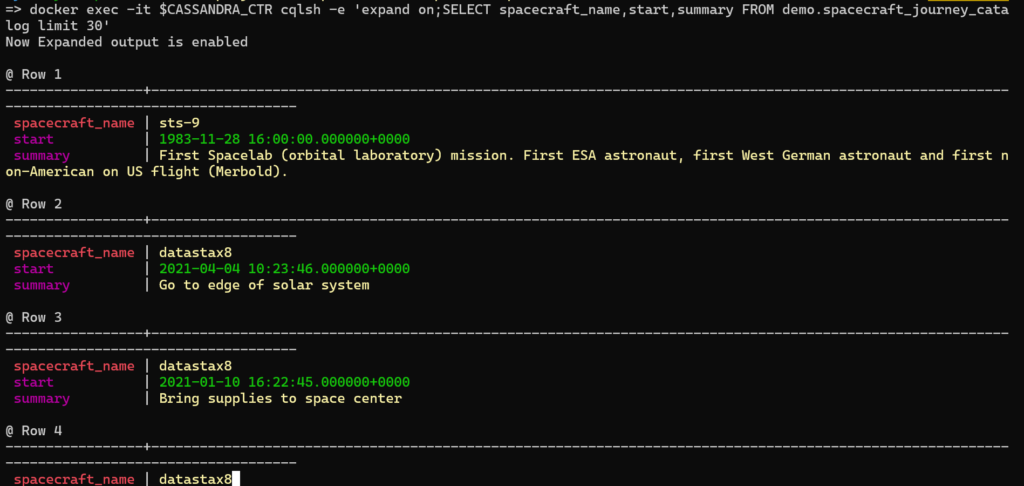
Or 2) Using Presto, e.g., using the Presto CLI:
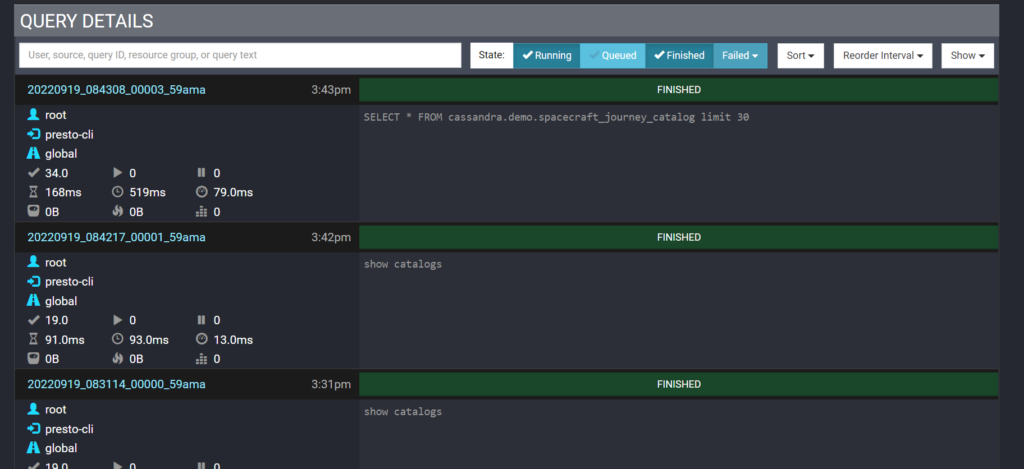
Again, although our main point of this exercise is to connect Cassandra to Superset, we also get other benefits of having Presto in the process, e.g., if you run some queries here, you can see a record of what queries were run in the Presto GUI Dashboard:
Step 2: Connecting Superset to Cassandra with Presto
Now that we have Cassandra hooked up to Presto, we can connect Presto with Superset.
Setup Superset
First, we will install Superset using docker compose. The recommended way to do this is through cloning the Superset repo and using their Dockerfiles and docker-compose yaml files directly. (Again, more detailed instructions can be found in our repo’s README).
This will set us up with a Superset instance with the following components
- web server: Gunicorn
- metadata database engine: Postgres
- message queue: Redis
- results backend: Redis
- caching layer: Redis
After running docker-compose up, it is now set up here: http://localhost:8088. After you log in, you are greeted with a screen that looks like this:
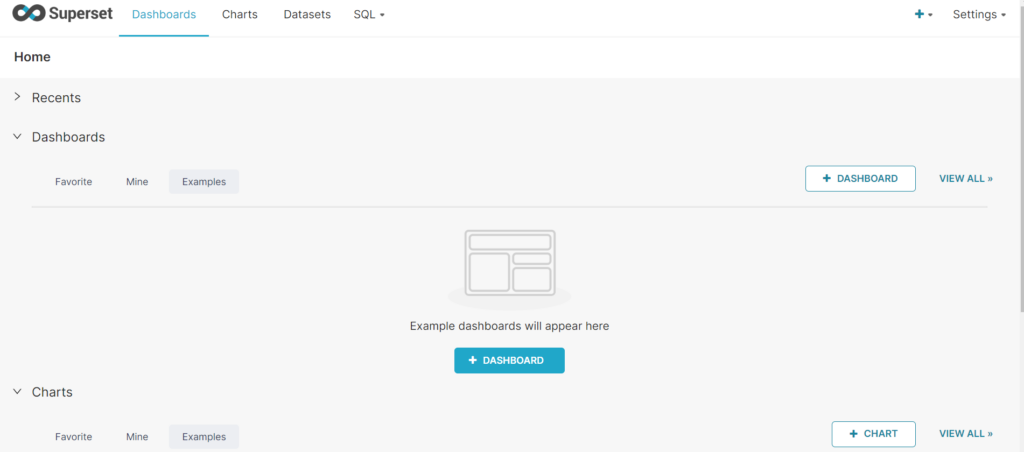
As nice as it is to start off with a “clean slate” as it were, it is even better to have some sample datasets without having to connect anything, and Superset provides just that. For example, there is a sample dashboard with World Bank Data:
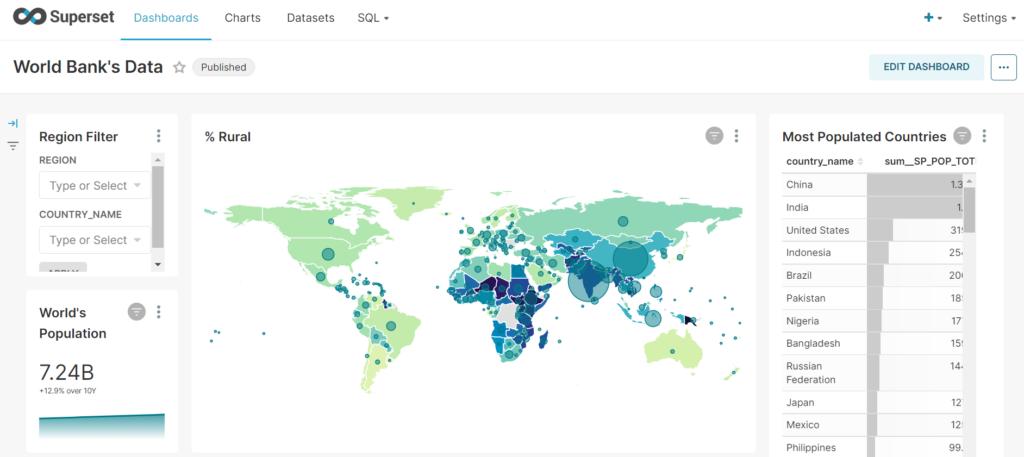
That won’t help us however, we want to see our data from Cassandra!
Connect Superset to Cassandra through Presto
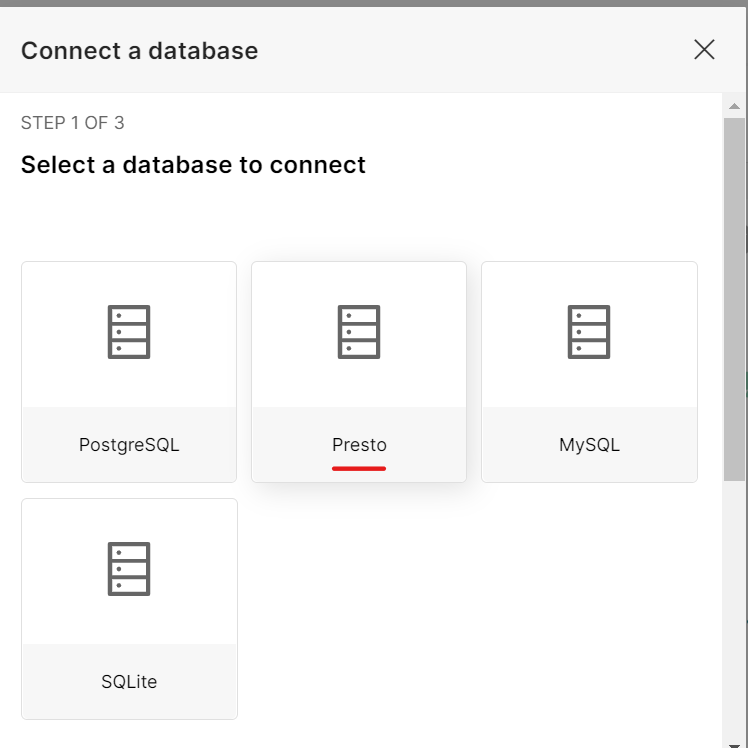
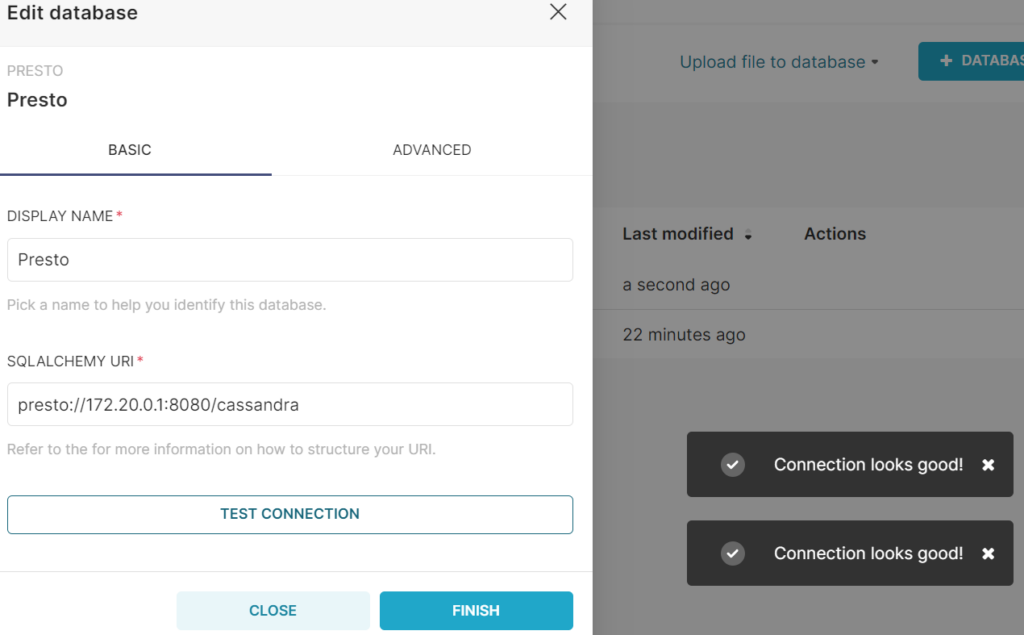
First, add a Data connection using “Data > Connect Database”:
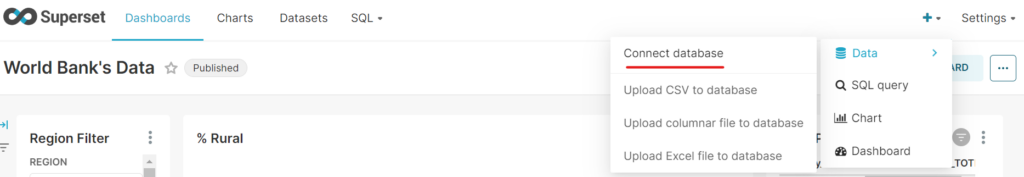
From there, select “Presto”:
One way to access Presto from Superset would be to put them in the same docker network, e.g., by putting in same docker-compose.yml file or chaining the two docker-compose.yml files using something like:
docker-compose -f ../superset/docker-compose-non-dev.yml -f docker-compose.yml up -dHowever, instead, we will just take advantage of the exposed ports on the Presto container. Get our host IP using:
hostname -I | awk '{print $2}'This will result in the connection address looking something like this (using cassandra as path, since that is what we named our catalog that connects to our Cassandra instance):
presto://<result-from-last-step>:8080/cassandraInsert that into the box, and test the connection to make sure it looks good:
Test Some Queries in Superset
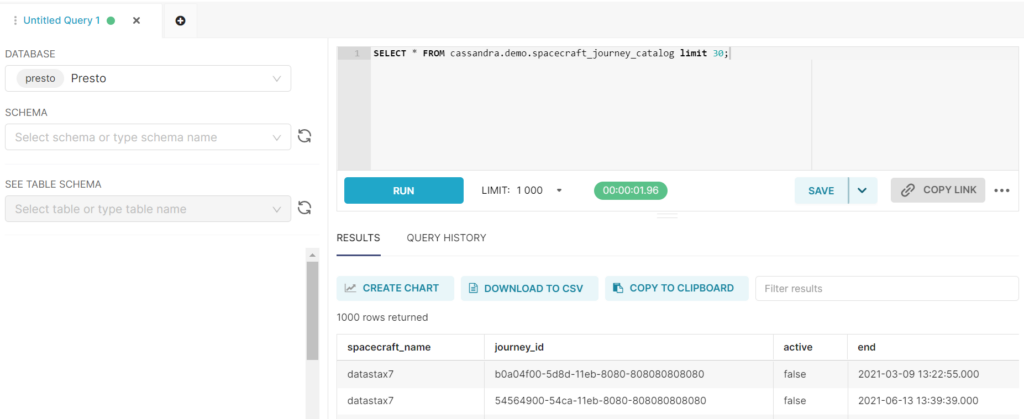
You should now be ready to run some SQL queries through Presto to read from your C* db. Superset includes an SQL IDE called SQL Lab expressly for this purpose.
Navigate to SQL > SQL Lab to get started:

Make sure to select “Presto” as your Database, and then you can run arbitrary Presto SQL in the query command box. The result should look like this:
Step 3: Visualize Your Cassandra Data
Of course, we didn’t go through all this trouble just so we could query our data! We want to visualize it!
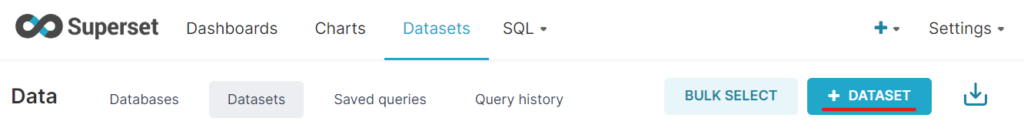
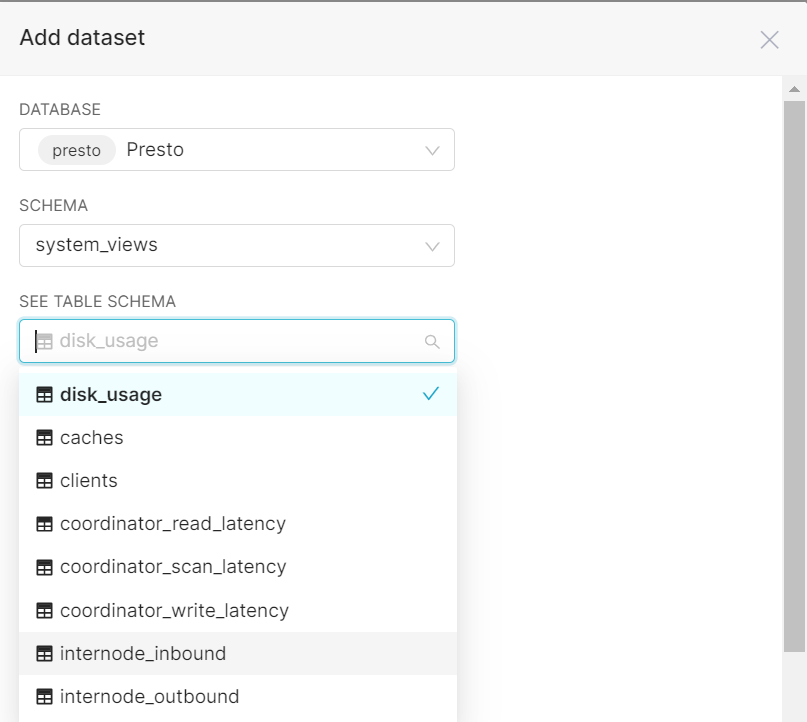
Finally, we are ready to visualize data from Cassandra in Superset. First, we need to create a “Dataset” in Superset. Navigate to “Datasets” and click the “+ Dataset” button:
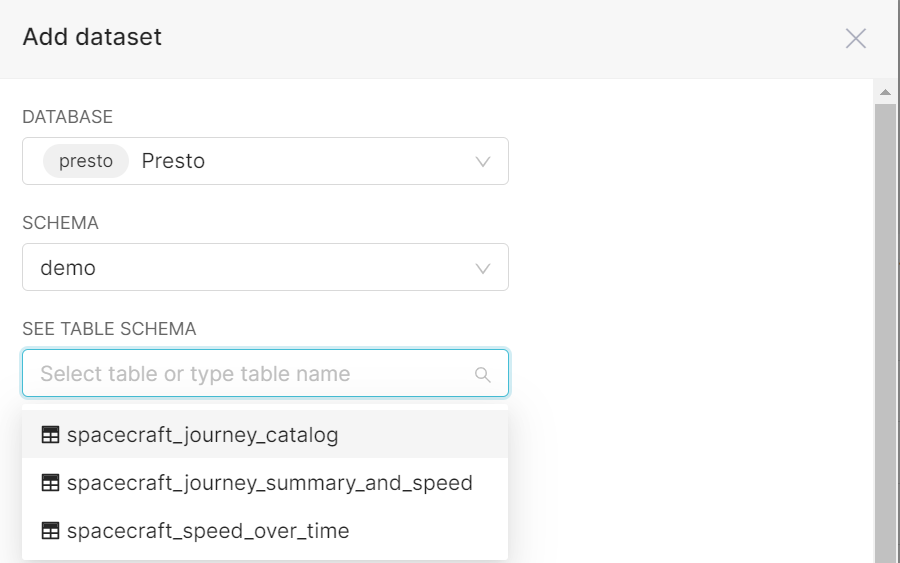
Let’s start with demo.spacecraft_journey_catalog:
Now let’s make some charts for demo.spacecraft_journey_catalog. Adding the table as a dataset will bring us to this view automatically, so we can just start creating some charts.
Visualize Spacecraft Data
Some examples include:
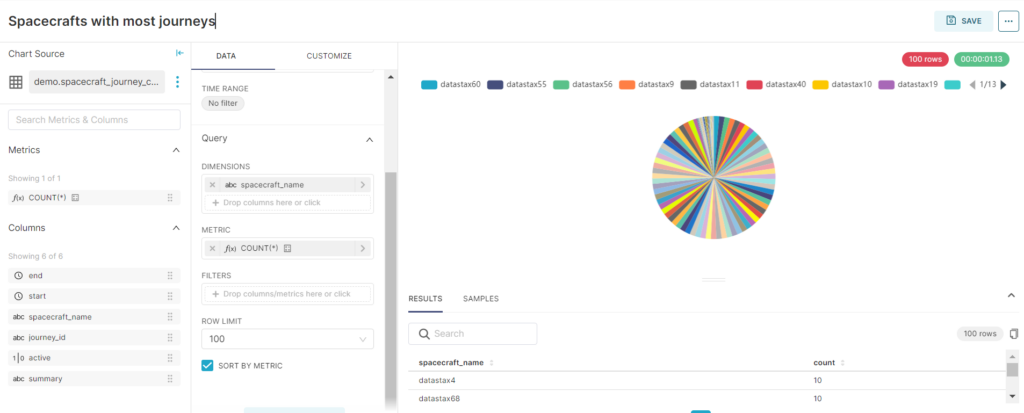
A pie chart showing “Journeys per spacecraft”
We can use a COUNT(*) query to see how many unique journey_id’s there are per spacecraft name.
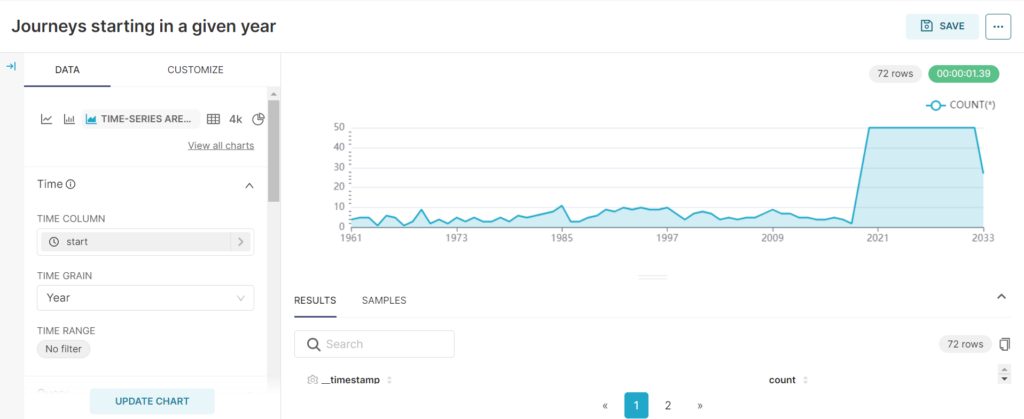
A time series chart for “Journeys per year”
By using the start column, we can do some time series line charts, such as finding out how many journeys started in a given year.
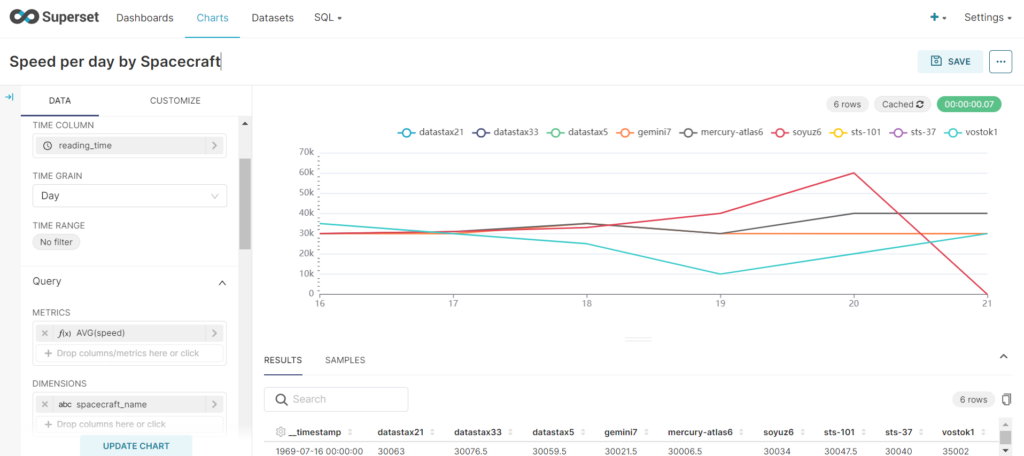
Speed over time
We can also do a similar thing with demo.spacecraft_speed_over_time. Make sure to set up the Dataset for this as well, just as we did with the previous C* table.
Visualize Cassandra Data using Joins
Part of the advantage of using Presto is that it allows joins between tables, which is not allowed in raw CQL. Of course, depending on your data model you might have to be careful running these operations so you don’t bring down your nodes (!).
As before, make sure to create all of the needed datasets first. Then run the join in SQL Lab:
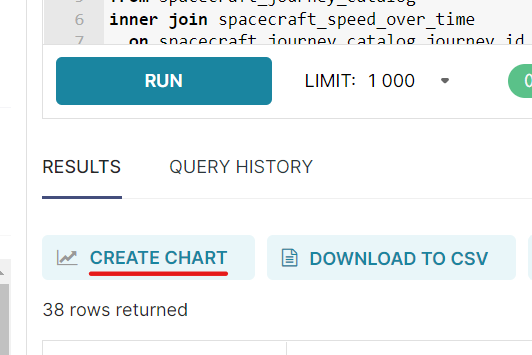
select spacecraft_journey_catalog.spacecraft_name, spacecraft_journey_catalog.summary, spacecraft_speed_over_time.speed, spacecraft_speed_over_time.reading_time from spacecraft_journey_catalog
inner join spacecraft_speed_over_time on spacecraft_journey_catalog.journey_id = spacecraft_speed_over_time.journey_id;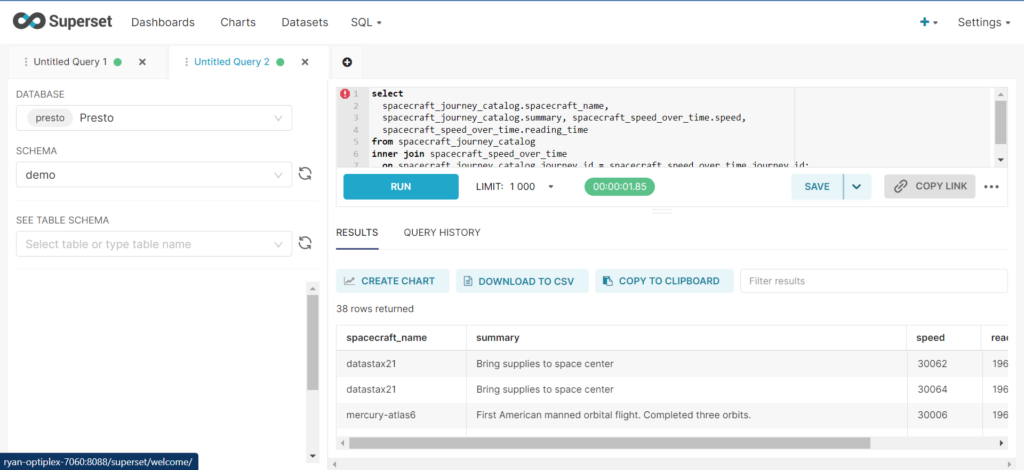
From there, click the “Create Chart” button to visualize the results.
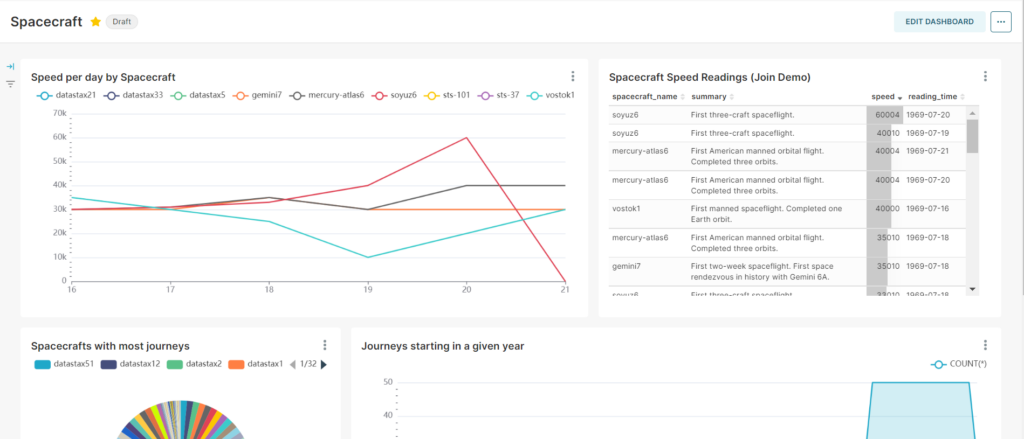
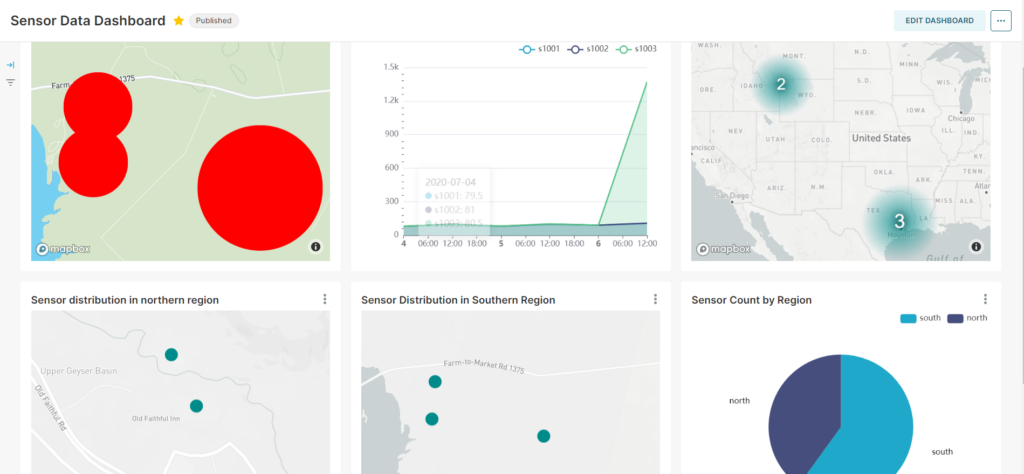
Put the visualizations together, and you have the start of a working dashboard:
Geocoding Visualizations
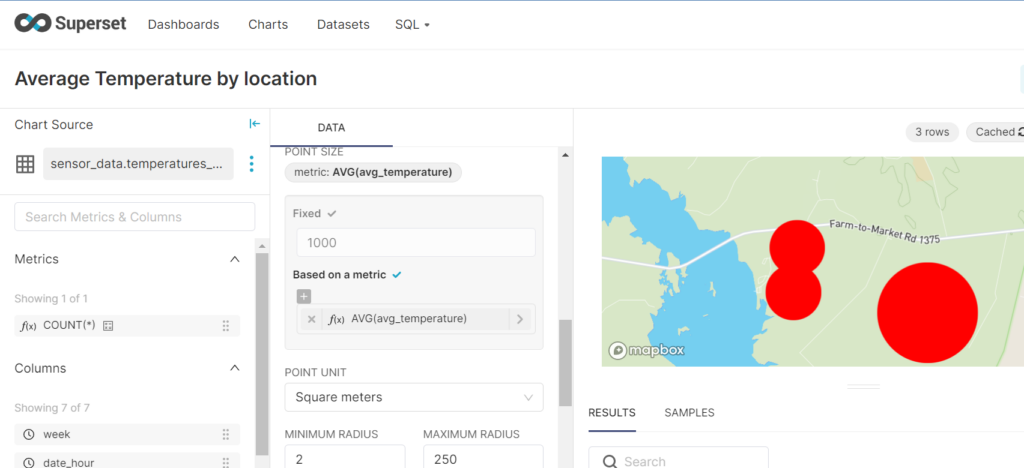
Using Datastax Academy Sample sensor data we can also get some cool maps going in Superset. This will require a Mapbox API token (the default public token worked great for me).
With a basic setup and the sample scripts included here, you can quickly generate some maps from your data:
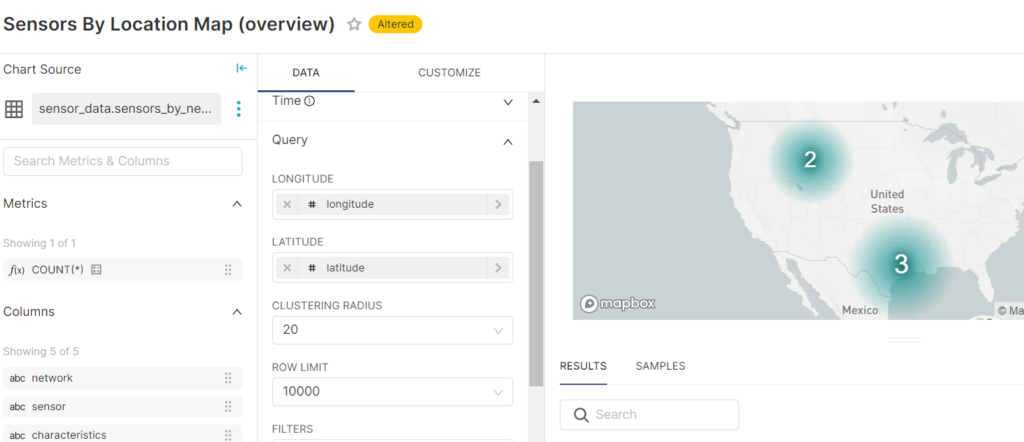
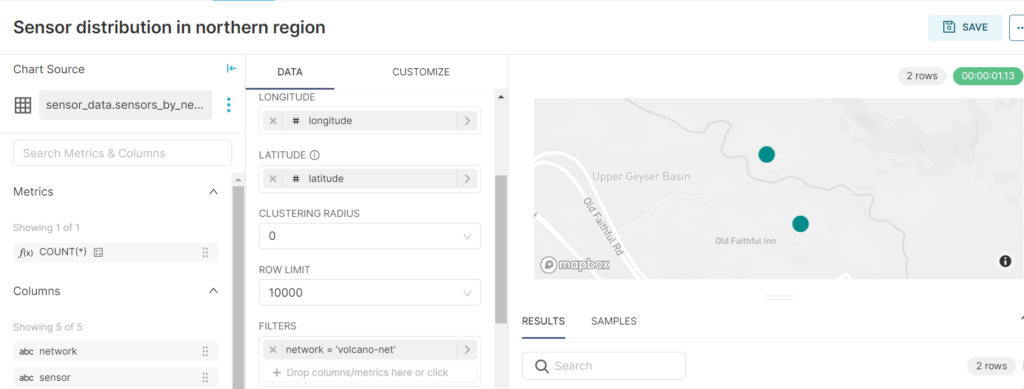
You can limit “Clustering Radius” to 0 (so that sensors are not grouped together at all) and filter by network name to see specific locations of sensors within a given network:
Making a chart representing temperatures for sensors is also pretty straightforward:
Already we see the advantages of what Superset calls their “simple no-code viz builder”. Even with such fairly generic datasets as we used here, we are able to derive insights and create visualizations without very much hassle or configuration at all. It did not matter that I have never even tried Mapbox before – all it took was a couple of columns with “latitude” and “longitude” data and we were able to create several visualizations that could be plotted directly to several different kinds of maps.
And again, using the charts we put together, we can view them together in a single dashboard:
Other Potential Use Case: Visualize Cassandra System Metrics
Before closing, I thought I would share another potential use case for Mapbox with Cassandra in particular. Without much effort at all, Apache Superset allows you to create custom visualizations for Cassandra system data using the system keyspace.
Of course, there are other tools made especially for Cassandra cluster metrics such as Prometheus with Grafana, but it is a possibility that might be worth exploring.
Conclusion
It is easy to tell why Superset has become so popular: it is powerful, it creates beautiful visualizations, and it is simple. Frankly, I was surprised at how seamless the whole process was. Having dabbled with various Python and Javascript charting libraries before, I found Apache Superset was extremely easy to use and well documented. There are sane defaults for what kinds of visualizations you want to make, but with quite a lot of customization allowed as well.
The initial integration process was also pretty straightforward. It would be nice to have some docker-compose files available that didn’t require cloning the whole Superset repo, but that is not even worth complaining about, and will probably come with time.
At the same time, this much infrastructure might or might not be reasonable for your project. Just to run Superset on its own, we needed to add Redis and Postgres. To visualize Cassandra data specifically in Superset, there is no direct connector at this point, unfortunately, which means users need to add an intermediate layer such as Presto or Trino in addition. If your project has some of these tools already, this might not be a problem, but it is something to consider.
Another potential concern would be if your charts need to have a lot of interaction, especially custom interaction. I did not explore thoroughly enough to say anything for certain and there is some interactivity available (e.g., see this demo from ApacheCon Asia 2022). However, in general, “no-code” means limitations for customization, so I would be careful in this regard if you have specific needs.
Credits
This post on how to visualize Cassandra data in Superset is built off of the more general post about Open Source BI Tools written by my teammate Arpan Patel.
Our spaceship dataset is based on the SparkSQL notebook from Datastax Studio. For the basic schema on which this was based, see the examples provided here. Data entries and schema were modified slightly by Arpan Patel and made available by his demo for Presto, Airflow, and Cassandra here. The data was modified again for this current demo.
We also borrowed from Datastax Academy Sample sensor data. Slight modifications were made to make sure it runs in the correct keyspace.